Energy Management System in Shopping Mall
Summary:
Present an international shopping plaza project, which adopts smart energy meters to collect various electrical parameters and switch signals at the distribution site. The system adopts on-site networking method. After networking, it communicates via fieldbus and transmits it in the background. Acrel-3000 energy management system performs real-time monitoring and management of energy consumption of floors and energy distribution rooms.
01
Project description
The project is located in the center of an economic development zone, with mature development, complete supporting facilities and convenient transportation. This project is the transformation of the energy use of the distribution rooms on each floor of the site. 757 power distribution output circuits with 757 multi-function meters were installed on site to collect field data.
02
Analysis of demand
Guarantee statistics and analysis of electrical load for production management and real-time monitoring of sources of danger. Real-time online monitoring of voltage, current, power and other parameters of electrical equipment, such as distribution boxes, is required at the project site. Once the monitoring point is monitored with abnormal parameters, it can detect and issue an alarm in time, and relevant personnel can take necessary measures to avoid safety accidents. The automatic meter reading function saves labor and material resources. The power trend curve function can intuitively display the working status and time of each circuit, which is convenient for users to find abnormal power circuits and make corrections in time, and establish an electrical energy measurement system multi-level to provide a basis for energy analysis.
This technical condition applies to the input and output circuits of the project. The supplier's products must have high security and reliability, be easy to expand, easy to repair and maintain. The products provided by the supplier shall at least meet the technical requirements, but not only this, the technical performance shall meet the requirements for equipment distribution box data monitoring.
1. Data collection
Automatically collect analog data from all power meters on site and automatically collect on-site switching data such as on-site breaker status and fault status.
Support real-time collection, configurable automatic periodic collection (time collection) cycle (1 minute to 24 hours).
Supports inspection of data transmission accuracy and automatic processing of abnormal data.
Supports multi-threaded processing mechanism, improves data collection efficiency, and can collect data from multiple devices at the same time.
The real-time data display adopts the intuitive display mode of the main wiring diagram of the distribution box, and the tripping and fault status of each circuit breaker is intuitively visible.
2. Data analysis and processing
Comprehensive statistics and data analysis should achieve thefollowing functions:
• Statistics and calculation of electrical consumption data for each equipment in hours, days, months, years and other time periods;
• Calculate the large, small and average value of electrical load (active power, reactive power) of each device;
• Count the energy consumption (active power and reactive power) of each substation and the whole;
3. Data query and visualization
It is required to facilitate customer inquiries and manager inquiries at all levels. The query interface can be adapted to the requirements of managers at all levels. It can support flexible condition join queries and comparative analysis. Various types of statistical analysis data can be flexibly used in reports and other charts. Intuitive display function.
According to the different permissions of different users, the data display function is divided into three layers: operation layer, management layer, and decision-making layer.
The operation layer has functions such as energy consumption analysis, accumulated consumption, real-time monitoring, execution logs and ratios, comparison and comparative analysis.
Management has functions such as statistics and analysis of energy consumption data, comparison of classifications and subheadings and benchmarking analysis.
The decision-making layer has functions such as energy data analysis, data deletion, and database import/export.
4. Authority Management
It is required to assign different roles to different users, and be able to authorize function submenus, specific file records, data records, etc.
The system requires a complete and reasonable user security control mechanism to protect information resources in the application environment and prevent information loss, theft and destruction.
5. Evaluation of effects and renewal of energy savings
It is required to provide data support for energy-saving production transformation and provide effect evaluation before and after energy-saving transformation.
6. Parameter Settings
The transformer ratio of each loop and the setting value of various current and voltage protections can be set through the acquisition cabinet.
Fault assessment and alarm have automatic fault assessment and use light and sound alarm function. Alarm types include switch failures, voltage and current overages, field acquisition module communication failures, and communication failures with the monitoring system. The alarm time is automatically recorded in the system database, which is convenient for users to query. The staff can grasp the operating status of the substation in real time at any time, find the operational fault of the substation and distribution and carry out corresponding treatments, improve the management efficiency of the substation and distribution, and improve the safety of the substation. electric system. reliability.
03
System solutions
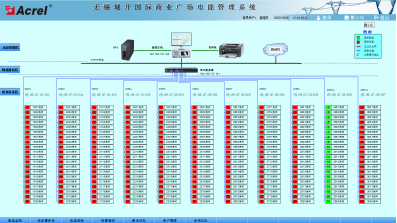
According to the actual situation of the project site, the Acrel-3000 system uses a shielded twisted pair cable to directly connect to the corresponding data collector in the monitoring room, and then directly connect to the monitoring host through the network, ensuring the transmission of the power management monitoring system. Stability and real-time performance. As shown in the following figure: station control management layer, network communication layer and field device layer.
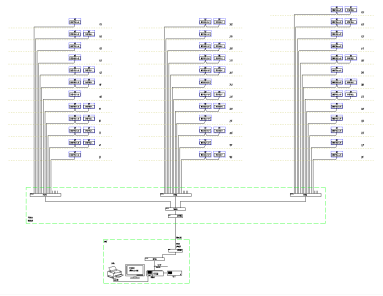
A total of 140 multi-function instruments on the site are divided into 12 RS485 buses connected to the industrial monitoring computer in the power distribution room to realize data connection between the instruments on the bus and the monitoring host.
1. Station Control Management
The station control management layer is the direct human-computer interaction window for the management personnel of the power monitoring system. In this project, it mainly refers to the monitoring host located in the power distribution room.
2. Network communication layer
The communication layer is mainly composed of the serial communication port of the industrial monitoring computer, the Ethernet equipment and the bus network. The main function of the serial port is to monitor intelligent instruments on site; The main function of Ethernet equipment and bus network is to realize data interaction between substation and main station, so that the management of the distribution system is centralized, computerized and intelligent, which greatly improves distribution. The safety, reliability and stability of the power system have achieved the goal of unattended operation.
3. Field device layer
The field device layer is the data acquisition terminal, which is mainly composed of smart meters. The smart meters connect to the communication server through shielded twisted pair RS485 interface and MODBUS communication protocol bus connection. The communication server reaches the monitoring host of the power distribution room to establish network connections. Perform remote control.
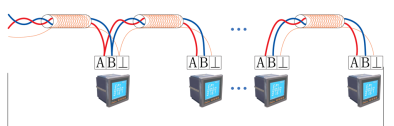
4. Smart Instrument Connection Diagram
Field instruments are connected hand-to-hand using shielded twisted pair (RVSP2*1.0). The number of smart instruments connected to each bus is about 20. Different types of smart devices are connected to different buses, and then the data is uploaded to the serial port. Then the server uploads the data to the local monitoring terminal. The specific connection diagram is as follows:
04
System functions
The on-site real-time monitoring system diagram is the main monitoring screen, which mainly monitors the operating status of all substation circuits in real time. Red represents closing and green represents opening. In the system diagram, you can intuitively see the operating parameters and status of each input and output line, and you can see all the conventional power parameters on the output side of the transformer, such as: three-phase voltage, current, active power. , reactive power and power factor, frequency, active power, etc. As it's shown in the following:
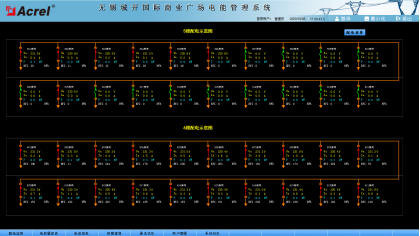
Diagram system
The remote signaling and remote measurement alarm function mainly completes the monitoring of the switch operation status of the low-voltage output circuits and the load incoming line. The pop-up alarm interface for load limit and switch displacement violations indicates the specific location of the alarm and sounds the alarm to remind service personnel to solve it in time. The load limit may be freely set under the corresponding authority. With historical query function.
The event alarm recording function mainly completes the recording of alarm information and the occurrence time of alarm information that occurred during the query period, and provides the basis for service personnel and analyzes the cause of the accident .
Parameter meter reading function, mainly to query the electrical parameters of the low voltage output circuit. Supports query of electrical parameters at any time, with functions such as data export and report printing. This report queries the electrical parameters of the low-voltage circuits of the input and output lines of the distribution box on the floor of the Yike Building, mainly including: three-phase current, active power and active energy. The name of each circuit in this report is associated with the database, which is convenient for users to modify the circuit name. As shown below:
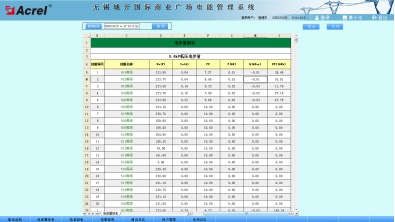
Reading electrical parameters
The power consumption report function can select the time period for query, supports cumulative query of power consumption in any time period, and has the functions of data export and report printing. Provide accurate and reliable electrical energy reporting to on-duty personnel. The name of each circuit in this report is associated with the database, which is convenient for users to modify the circuit name. As shown in the figure below, it shows the exact power consumption of the power distribution circuit in the laboratory building of the office building. Users can directly print the report and save it to other locations in EXCEL format. As shown below:
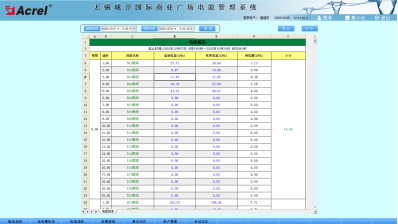
Energy report
A schematic diagram of the communication structure of the system, mainly showing the network structure of the system. The system adopts a hierarchical distributed structure and monitors the communication status of the bay layer equipment. Red indicates that the communication is normal and green indicates that the communication is faulty. The following figure is a schematic diagram of the communication status of the substation.
Communication structure diagram
In the charging trend curve interface, the loop charging operation can be seen intuitively. View real-time and historical trend curves, click the corresponding button or menu item on the screen to complete the corresponding function change; Helps users enter line trend analysis and fault recovery, with curve printing function. Provides intuitive and convenient software support to analyze the operating status of the entire system.
05
Summary
In the application of current power distribution facilities, the safety of power distribution is of utmost importance. The application of Acrel-3000 energy management system introduced in this article in the shopping plaza project can realize real-time monitoring of the energy consumption of the power supply and distribution circuit, not only can display the circuit. The power consumption status also has network communication function, which can form an electric power management system with serial server, computer, etc. The system performs analysis and processing of the collected data, real-time display of the operating status of each power distribution circuit in the power distribution. room, alarm pop-up dialogs, voice prompts for load overflows and generates various energy reports, analysis curves, graphs, etc. It is convenient for remote meter reading, electrical energy analysis and research. The system is safe, reliable and stable in operation. Provides a safe and reliable foundation for the shopping plaza project to solve electricity problems and has achieved good corporate benefits.
Next: No more